
Contemporary technologies inspire radically divergent diagnoses. On one side, they are portrayed as the main engine of a new wave of growth and jobs, driven by automation, computing, the internet, and now artificial intelligence. On the other, they are taken to signal a darker rupture, in which work tends to recede—up to the point of nearing disappearance as a theoretical horizon. This concern is formulated in very different ways by Marx, Ellul, Rifkin, or Stiegler, yet it converges on one point: the machine would ultimately erode the very income base derived from labour. Between these poles, analyses oscillate, because advanced economies simultaneously display the widespread diffusion of technologies, the growing dominance of digital giants, and persistent strains in productivity, employment, and demand.
This article does not aim to date a turning point, nor to prophesy an “end of work”. Rather, it seeks to identify trends that are already observable and statistically well supported, drawing on macroeconomic indicators. In this spirit, paradoxes that are hard to interpret—for instance, the idea that the penetration of technologies would not translate clearly into certain aggregate productivity measures—are set aside. The aim here is to illuminate a readable causal sequence, rather than to settle measurement debates.
We will begin by revisiting Schumpeter’s concept of creative destruction, because it provides a guiding framework: innovation creates temporary margins, reorganises sectors, reallocates employment, and then the diffusion of gains feeds demand and reignites investment. The example of cotton textiles in the 18th–19th centuries will serve as a concrete anchor. From the outset, it reveals the interweaving of innovation, international competition, the reorganisation of work, and social conflict—helping us avoid reducing creative destruction to a mechanism purely “internal” to technology.
In the second part, we will turn to the contemporary period, focusing on the United States—both because its digital lead remains structurally influential and because its sectoral statistics make it possible to track robust trends. An operational distinction will be used—tangible and intangible channels—to map the diffusion of innovation across the economy as a whole. On this basis, we will first examine the slowdown in productivity gains in emblematic tangible sectors, then set it against the more favourable dynamics of intangible sectors, where the central issue is not only innovation, but its diffusion and, above all, its concentration.
The third part will revolve around the closing variable: demand. If automation advances in tangible activities and concentration dominates in the information economy, pressure on employment, participation rates, median incomes, and consumption may intensify. We will broaden the perspective by integrating factors that interact with technological dynamics—globalisation, restructuring, and ageing—before proposing an overall conclusion: creative destruction does not necessarily fade away, but it can operate “under pressure”, to the point of tending towards a vicious circle in which weakened demand encourages automation, and automation, in turn, undermines demand.
Creative destruction
Schumpeter’s theory
In classical and neoclassical economic theories, competition and the market play a central role. They are meant to be regulated so that they are not distorted, and not obstructed, in order to prevent the formation of monopolies and to optimise prices. Whereas actors appear in these conceptualisations as interchangeable individuals, Schumpeter (1911) conceives of the entrepreneur as a figure endowed with uncommon qualities, able to innovate or to exploit existing inventions in order to create “new combinations” of the means of production and to turn them into flourishing industries.1
Entrepreneurs who succeed are followed by others who compete with them, gradually driving prices and profits down. The market then slows until new innovations emerge or new needs arise. In this setting, where successive “revolutions” unfold, firms must innovate regularly in order to remain profitable and survive.2
Although Schumpeter’s approach has been criticised and reworked, it remains structuring in many contemporary economic theories.3 In this view, innovations act as breaks that raise productivity and generate temporary margins. These can be reinvested or redistributed—especially in a Fordist configuration—and help sustain activity through demand. In what follows, this schema serves as a reference point: the aim is to examine its empirical manifestations using macroeconomic indicators.
Cotton textiles in the 18th and 19th centuries
In the 18th and 19th centuries, cotton textiles provide a typical example of creative destruction because they combine, from the outset, international competition, technical innovation, and the reorganisation of work. England does not “start” from nothing: at the beginning of the 18th century, Indian cottons (calicoes, muslins) already circulate through globalised trading networks, and they fuel in Europe a new demand for lighter, colourful, easy-to-wash fabrics.4 This demand rests largely on production located outside Europe, which creates competitive pressure on British producers and makes visible a first form of destruction—not by the machine, but through the importation of goods manufactured elsewhere.5
The English response unfolds in two stages. First, Parliament establishes tariff protection by adopting the Calico Acts (1700 and then 1721), which prohibit or sharply restrict the use, and above all the sale, of printed cottons, in order to protect the wool and silk manufactures; competitive pressure is thereby reconfigured rather than eliminated. In the second half of the 18th century, spinning is transformed: innovations such as the spinning jenny, the water frame, and then the mule sharply increase the quantity of yarn produced per worker, shifting the centre of gravity of production from the domestic sphere to workshops, and then to factories.6 The immediate effect is a rupture in the old balance between spinning and weaving: when yarn becomes abundant and cheaper, the organisation of work is rearranged, manual trades specialise, and pressure is now exerted on weavers.7 As water power, then steam, establishes itself in spinning mills and the power loom spreads, textiles become a sector in which productivity advances in steps—innovation, capacity expansion, cost reduction, and the growth of volumes.8
This dynamic destroys skills and incomes locally. Home-based trades are transferred to spinning and weaving factories, regions must reconvert, and social conflicts arise when the machine appears as a direct substitute for artisanal labour.9 The social upheaval affects men as well as women and children: in the domestic, or putting-out, system, production already mobilises family labour on a massive scale—especially that of women and children—which makes the idea of systematic reliance on this workforce culturally more “natural”.10 With the factory, mechanisation further segments operations and lowers certain skill barriers: the monitoring of machines and ancillary tasks are entrusted to children, while women and young girls occupy a growing share of positions in mechanised workshops, especially as weaving industrialises.11 This reconfiguration contributes to the upheaval of occupations because it shifts the value of know-how—from craft to industrial organisation—and it alters the balance of power in the labour market.12
Technical innovations and sectoral restructuring are stimulated by geographical concentration (notably in Lancashire) and by the rise of a manufacturing capitalism capable of financing infrastructure and equipment, organising supply, and selling mass production.13 This capitalism is embedded in globalised exchanges and in the expansion of the British Empire: cotton production depends on imported raw materials, often produced in coercive systems (notably slavery in America), and it seeks external outlets to stabilise volumes.14
These preceding industrial, commercial, and political dynamics bring about a reversal of fortunes: long a major centre of textile production, India undergoes, in the first half of the 19th century, British competition and colonial domination, to the point that entire regions of artisanal weaving contract and British cottons begin to flood the Indian market.15
The example of cotton textiles in the 18th and 19th centuries shows that destruction is not only the “internal” product of an innovation. It also results from external commercial pressures exerted by Indian competition, from international political ambitions that exports partly help to finance, and from geographical shifts in production.16 Keeping this example in mind, we will ensure, in the third part, that political and social factors are taken into account in order to illuminate the contemporary dynamics as far as possible.
Technological pressure
Analytical focus on the United States
Today’s world differs profoundly from that of the 19th century. The first difference—which we wish to highlight here—lies in the radical technological shift that has taken place since the end of the 19th century. After steam engines, electricity, electromagnetism, oil and internal-combustion engines, industrial mechanisation, engineering, telecommunications, nuclear power, quantum mechanics, computing, the internet, automation, and, more recently, artificial intelligence and robots, have continued to transform societies at great speed—and, more particularly, their economies.
Since 1945, the United States has built a technological lead that remains significant, especially in computing. In early 2026, seven of the ten largest companies in the world by market capitalisation (Nvidia, Apple, Alphabet/Google, Microsoft, Amazon, Broadcom and Meta/Facebook), based on the US West Coast, belong to the digital platforms and technologies sector.17 This situation justifies focusing our statistical analysis on the United States: if it faces the constraints discussed above, countries at a comparable level of development are likely to face them as well.
Let us break the US economy down into broad sectors and, for each sector, briefly list the different intangible and tangible channels through which technological innovations permeate these sectors. The intangible/tangible concepts are taken from Jonathan Haskel and Stian Westlake.18 They make it possible to distinguish, on the one hand, flows of information, software, computer programs or artificial intelligences and, on the other, machines, robots, sensors or other equipment that acts upon physical objects. Obviously, this distinction is rarely applicable in a strict sense, insofar as virtually every machine now depends on computing elements. It nevertheless provides an analytical tool for identifying trends in the impact of technologies on the economy.
The table below makes it possible to grasp the broad diffusion of technologies across the entire economy and to identify whether there is a dominant channel in the sector’s technical developments.
| Sector | Intangible channels | Tangible channels | Dominant channel(s) |
| 1) Material transformation and field operations (agriculture, mining, utilities, manufacturing, construction) | process control; planning/scheduling; predictive maintenance; quality analytics; digital twins; design-to-production toolchains | industrial robots/cobots; CNC and automated lines; autonomous/remote machinery; sensors/actuation; site equipment automation | mixed (tangible execution + intangible control) |
| 2) Movement and distribution (transport, warehousing, postal, wholesale/retail logistics) | routing/optimisation; demand forecasting; inventory planning; workforce scheduling; pricing; fraud/shrink analytics | warehouse robotics (pick/pack, sortation); AGVs/AMRs; automated storage; scanning/vision in handling; partial autonomy in vehicles | mixed (often tangible in warehouses; intangible in networks) |
| 3) Informational economy and business services (routine office production + knowledge/symbol production; excludes real estate) | workflow automation (RPA/BPM); document AI; LLM-based drafting/summarisation; search/retrieval; analytics and forecasting; coding and software copilots; compliance monitoring; decision support; customer support automation; marketing automation | minimal (end-user devices; occasional specialised hardware; most compute is upstream in data centres) | intangible |
| 4) Real estate and rental and leasing | listing/search/matching; automated valuation and pricing support; lead qualification; document processing (leases, KYC where applicable); property management workflows; scheduling and tenant communications; predictive maintenance scheduling; fraud/risk screening; portfolio analytics | building management systems (HVAC/energy optimisation); access control/security systems; sensors/IoT; limited robotics in large facilities (inspection/cleaning in constrained settings) | mixed, but often “thin automation” relative to sector weight (intangible transaction/management layers; tangible in building ops) |
| 5) Human services under professional liability (health/social care, education, childcare, parts of justice) | documentation and coding; triage and scheduling; decision support; personalised tutoring; case management; monitoring/alerts | assistive devices; some robotics in constrained clinical tasks; sensors/telehealth devices; lab/diagnostic automation | intangible-dominant (with pockets of tangible) |
| 6) Hospitality and personal services (tourism-facing activities: accommodation/food, leisure, personal services; plus visitor retail) | booking/pricing; concierge/chat support; translation; staffing optimisation; review mining; marketing automation; ordering/payment flows | cleaning/food-prep robotics in standardised settings; kiosks; some back-of-house mechanisation; security/access systems | mixed but often intangible-dominant (tangible mainly in standardised back-of-house) |
| 7) Public administration and security (public admin, regulators, agencies, defence support functions) | case intake/triage; form processing; correspondence drafting; compliance checking; fraud detection; procurement analytics; knowledge management | selective (border/security tech; surveillance infrastructure; some robotics in defence contexts) | intangible |
Limits to productivity growth
For Robert J. Gordon, the extraordinary acceleration of growth—and above all of living standards—rests on the “systemic” character of the technologies of the 2nd Industrial Revolution, whose core lies between the end of the 19th century and the beginning of the 20th. Electricity, running water and sanitation, the internal combustion engine (and the entire automotive ecosystem), as well as communications networks and part of the chemical innovations, constituted general-purpose technologies that reconfigured both production and everyday life. Their diffusion eased strong material constraints (in terms of energy, transport time, domestic drudgery, or public health), enabling large-scale gains in productivity and wellbeing, because these gains accumulated and reinforced one another through infrastructures (electricity grids, water networks, roads, etc.).19
Gordon argues that this sequence is difficult to reproduce: once the major networks are in place and the main uses have stabilised, the same leverage effects can no longer be obtained. Post-1970 innovations—especially digital technologies—remain important, but they would have a more concentrated impact (information, communication, entertainment, organisation) and be less “transformative” with respect to the physical constraints of existence and the tangible sectors in the broad sense. Hence the idea that, even if digital technologies bring real improvements, they do not recreate the shockwave of innovations such as electrification, motorisation, modern hygiene, or household equipment. Gordon also stresses that the productivity surge associated with ICT was limited in time (often located around the late 1990s and early 2000s), before a return to a slower dynamic.20
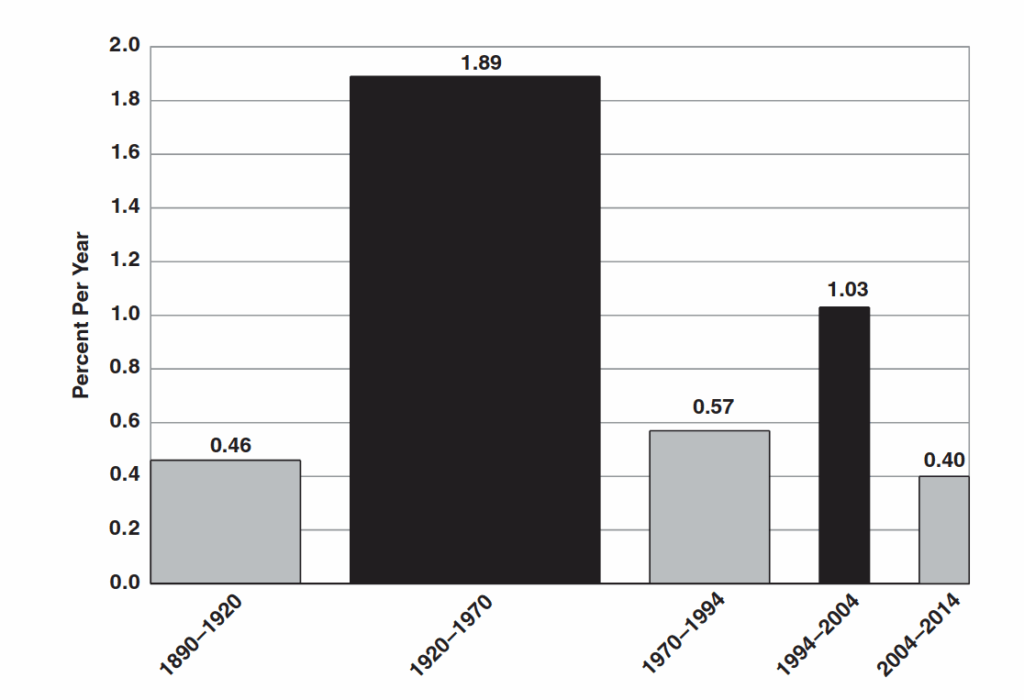
Tyler Cowen advances a similar thesis, but with a different metaphor: the American economy (and, more broadly, advanced economies) would have “eaten” the low-hanging fruit. The decisive technologies of the 19th and 20th centuries (transport, refrigeration, electricity, mass communications, sanitation, etc.) generated exceptional gains because they combined with two other, partly non-technological but complementary, drivers: abundant land (the frontier) and the rapid rise of human capital through mass schooling. Once these sources of expansion are largely exhausted, the remaining innovations tend, in his view, to be more incremental, to diffuse more slowly into the real economy, and to produce less “broad-based and shared” growth—which helps explain the stagnation of median incomes observed since the 1970s, even when some sectors innovate strongly.21
Gordon’s and Cowen’s theories emphasise that the productivity gains of the 19th and 20th centuries were extraordinary and difficult to reproduce. Ayres and Warr, and then Kümmel, add a further key to understanding this limited reproducibility: their central idea is that 20th-century growth is poorly explained unless energy is treated explicitly as a capacity to produce “useful work” (exergy), alongside capital and labour. In this framework, a substantial share of productivity gains stems from improvements in conversion efficiency (more physical work per unit of energy) and from engineering progress (engines, thermal processes, heat recovery, flow organisation). The structural consequence is that these gains cannot increase indefinitely: they face thermodynamic and technical limits (efficiency frontiers, diminishing returns), which makes a gradual levelling-off of productivity plausible in activities that involve moving, transforming, and assembling matter, even if information processing continues to improve.22
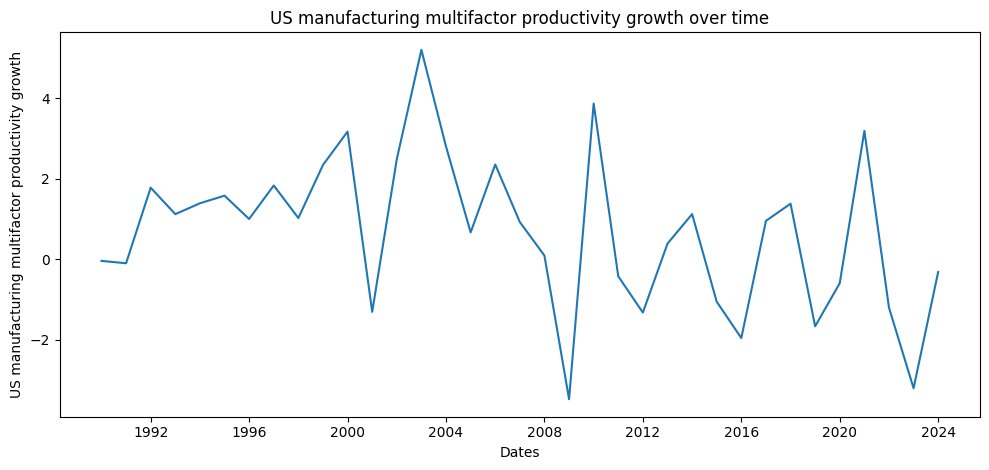
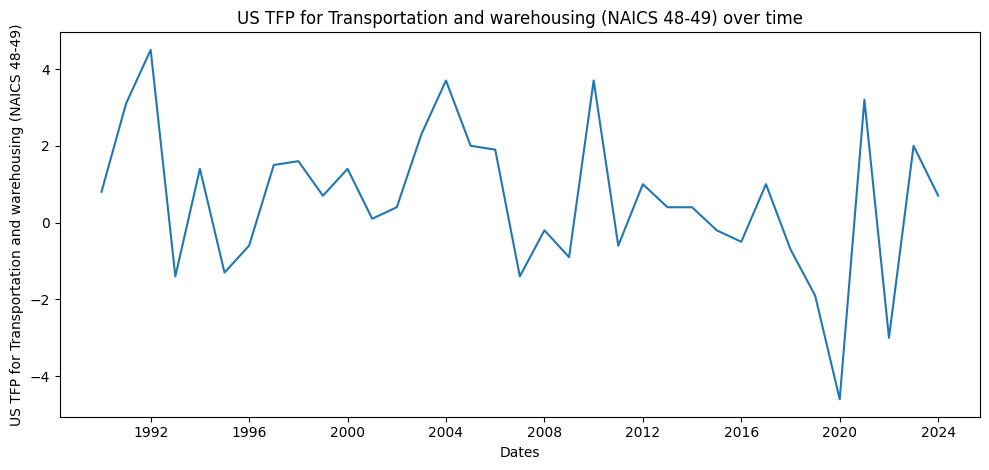
What do recent statistics show? Since 2005,24 manufacturing, transport, and logistics have recorded a marked and statistically significant reduction in total factor productivity (TFP) growth:
| Sector | Average annual TFP growth 1996–2004 | Average annual TFP growth 2005–2024 | Difference 1996–2004 / 2005–2024 | p-value (mean break, Newey–West/HAC) |
| Manufacturing | 2.06 | -0.01 | -2.07 | 0.000004 |
| Transport and logistics | 1.23 | 0.11 | -1.12 | 0.0118 |
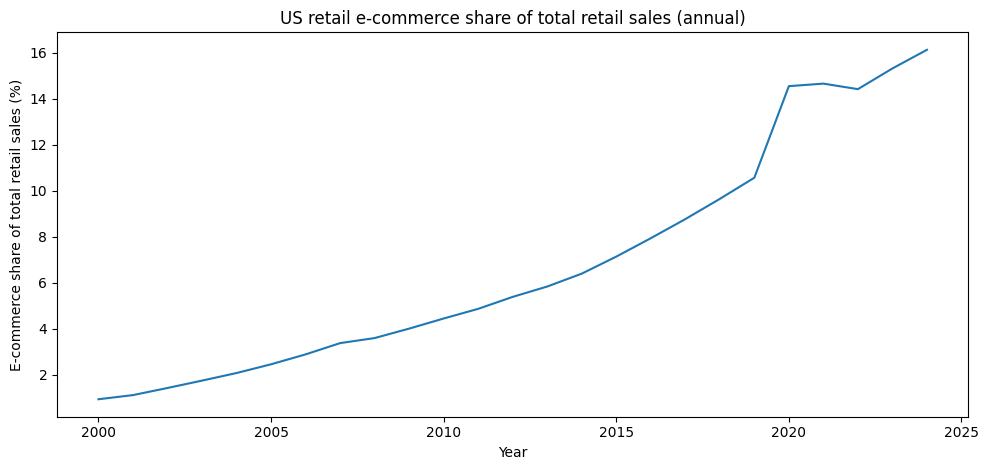
Focusing more specifically on logistics, still taking 2005 as the transition year, warehouse employment rises by +3.7% over 2005–2024 compared with 1996–2004,25 while revenue growth declines by 2.79%.26 This gap could be explained in part by the rise of e-commerce, especially since 2020 (Chart 4), where two opposing trends coexist. On the one hand, preparing large volumes of orders for individual consumers, with few order lines, mechanically weighs on productivity; on the other hand, because e-commerce fulfilment processes (still relatively recent) are less stable and less optimised than those of industrial production lines, they are subject to automation and optimisation that can generate productivity gains.27
If one treats manufacturing as the frontier of tangible sectors in terms of production-process optimisation, the figures above indicate a levelling-off of productivity gains since 2005 in tangible sectors. The hypothesis of a productivity ceiling appears, as the logistics example suggests, to depend on the stability of production processes—itself linked to the stability of demand for a given type of good.
Concentration in intangible sectors
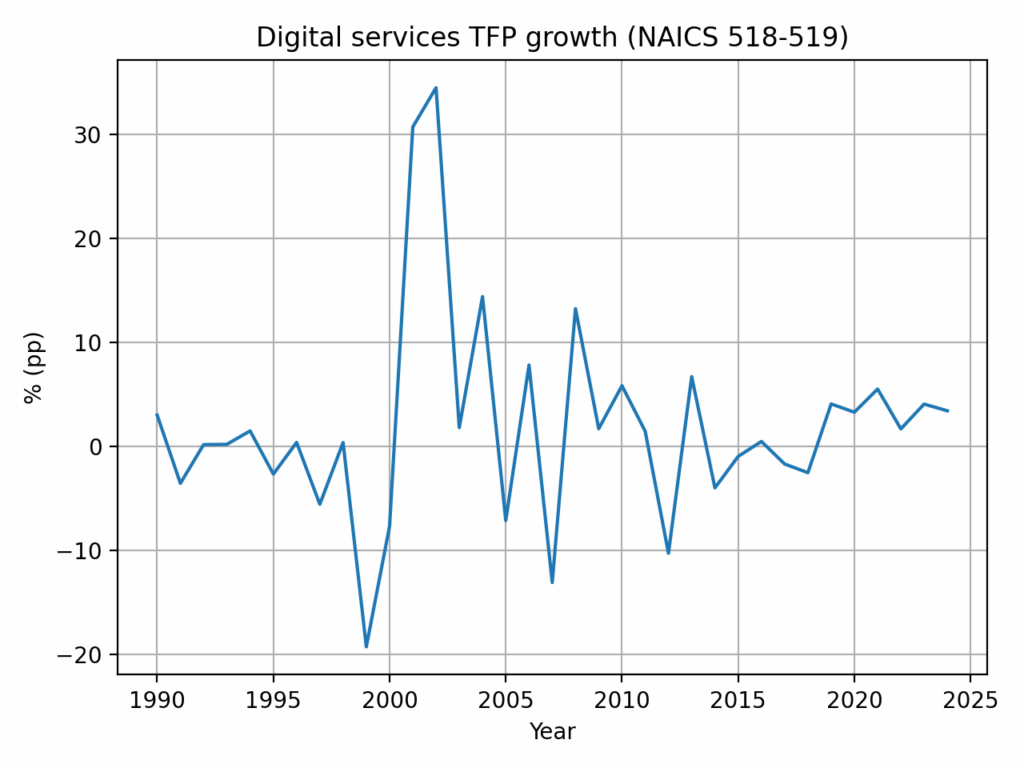
So far, intangible sectors do not appear to face productivity-growth limits comparable to those of tangible sectors (Chart 5). This does not mean that they are free of constraints linked to computing capacity and energy sources, but advances in artificial intelligence or quantum computing do not, for the time being, make it possible to identify these constraints precisely.
The substantial productivity gains that intangible sectors may still contain do not necessarily translate into job creation and overall growth, because of the concentration of firms: a handful of giants (Apple on the applications side; Alphabet/Google, Microsoft and Amazon on the platforms and hosting side; Meta/Facebook; OpenAI; etc.) tend to share a global market. This is often described as a “winner-take-most” or even “winner-take-all” dynamic.
Competition authorities must therefore intervene on a regular basis. In September 2025, Alphabet avoided an obligation to sell its internet browser Chrome, but it was required to provide a degree of openness with respect to its search engine (Google).29 Meta, for its part, won its case in November 2025.30 The company was accused of breaching antitrust laws because of its acquisitions of Instagram and WhatsApp.
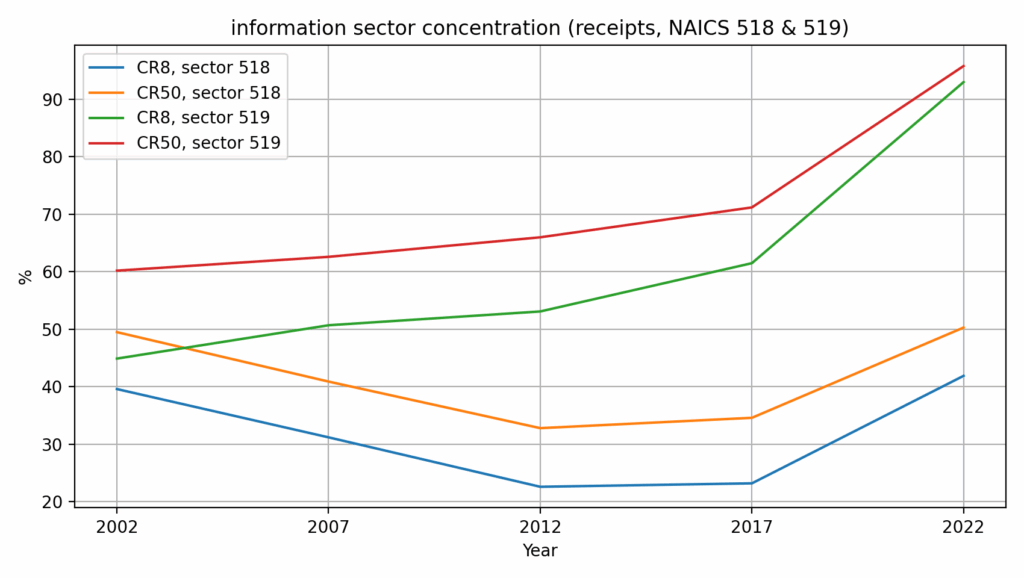
This sectoral concentration is not merely an impression conveyed by these emblematic examples; it is borne out by the statistics:
Beyond the level of concentration, a decisive point for creative destruction is the capacity of digital innovations to diffuse beyond “frontier” firms (the most advanced). Yet several strands of microeconomic research show that part of the advanced economies—and especially the United States—has experienced, for several decades, a decline in business dynamism, in the sense that entry and exit, and the reallocation of jobs across establishments, are weakening.31 When the turnover of the productive fabric slows, innovation may remain strong at the frontier, but it is transmitted more slowly to the rest of firms, sustaining a two-speed economy with a more persistent productivity gap.32
A particularly telling result is the decline in the share of young, very high-growth firms—in other words, the rarer occurrence of rapid expansion phases which, historically, turn an innovation into a reshaping of the productive landscape.33 In a world where digital technologies favour the rapid scaling of leaders (scale effects, intangible assets, data), this decline in “young extreme-growth firms” means that competitive pressure through entry less often plays its role as a vector of diffusion and discipline.34 It follows that technological gains are more likely to remain concentrated in a small number of actors, while the rest of the economy incorporates them more slowly—reducing the macroeconomic amplitude of creative destruction, even when frontier innovation remains sustained.35
Impact on demand
The limits to productivity gains encountered in tangible sectors are likely, over the long run, to encourage investment in machines and robots that optimise the cost/quality/lead-time triad—and thus to increase the capital–labour ratio. Yet machines and robots, as capital, may be able to operate with little to no interruption, but they do not consume. Well, economic growth depends on demand as well as on supply.
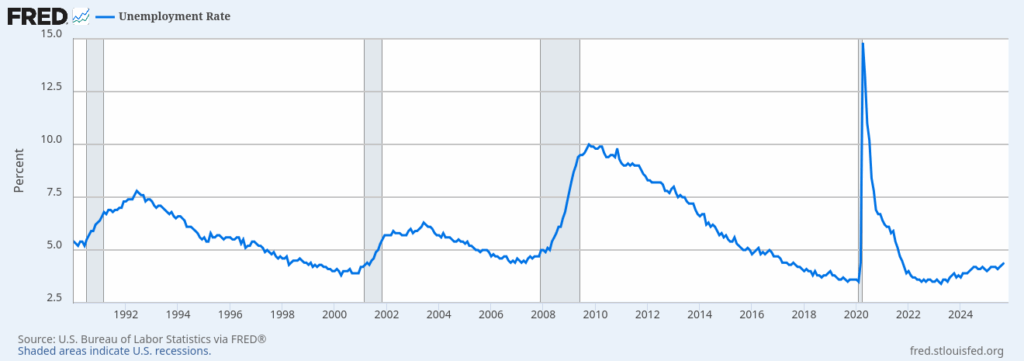
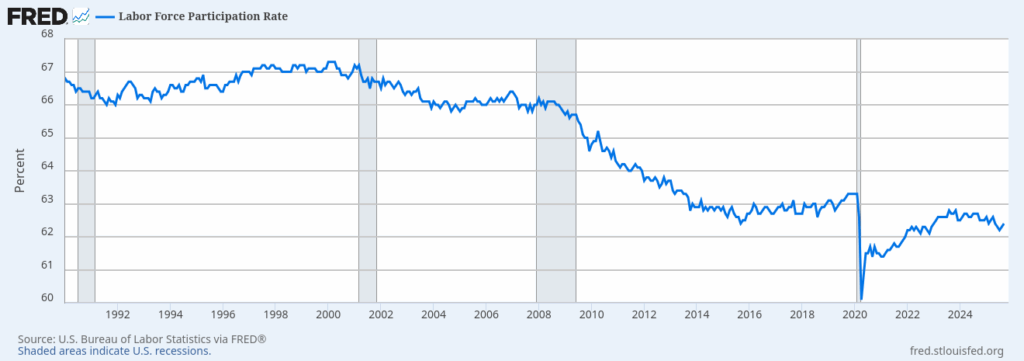
In intangible sectors, the trend towards concentration reduces staffing needs at the scale of a sector that extends beyond national borders. One way or another, this trend should translate into a lower participation rate. The US unemployment rate (Chart 7) does not appear to point in that direction, since it has been below five per cent since 2021. Two factors should, however, be taken into account: the United States leads in digital platforms and technologies; and the unemployment rate does not capture the participation rate (Chart 8), which has fallen from 67% in the early 2000s to just over 62% recently.
Mechanisation in tangible sectors and concentration in intangible sectors put downward pressure on consumption. When gains concentrate and median incomes do not keep pace, demand becomes a bottleneck.
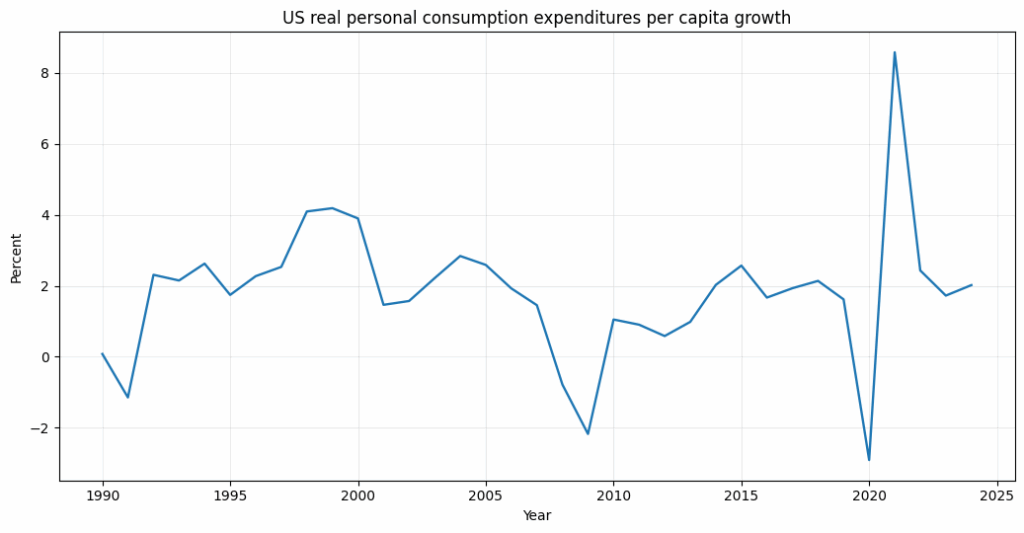
| Average annual PCE growth 1996–2004 | Average annual PCE growth 2005–2024 | Difference 1996–2004 / 2005–2024 | p-value (mean break, Newey–West/HAC) |
| 2.78 | 1.52 | -1.27 | 0.0265 |
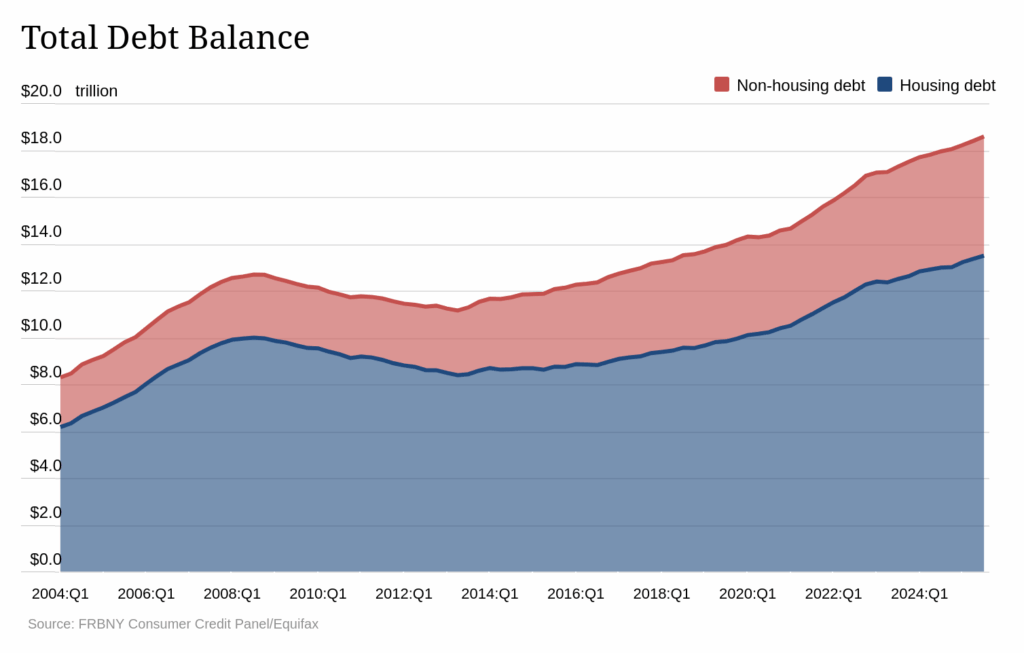
The growth rate of personal consumption expenditures per capita declines markedly after 2005. Note that this decline may be offset by household borrowing, or by current developments linked to artificial intelligence which, at times, entail the construction of infrastructure to host the servers required for its operation.
Globalisation, restructuring, and ageing
Alongside the technological constraints weighing on creative destruction, there are additional constraints related to globalisation, the challenge of managing sectoral restructuring, and population ageing in Western countries. To analyse these factors, we widen the geographical perspective to the world as a whole.
Offshoring and international competition
Offshoring, which has multiplied since 1990 in the context of intensified international economic competition, helps explain how demand growth could be sustained despite the underlying slowdown observed in several tangible sectors. In particular, offshoring to China accelerated in the 1990s–2000s, with a clear milestone: China’s accession to the WTO on 11 December 2001.
For Richard Baldwin, this episode fits into a broader transformation of globalisation: computing and telecommunications made possible a fine-grained “fragmentation” of production by separating tasks that had previously been co-located (design, components, assembly, logistics, etc.).39 This relocation of production stages to low-wage countries does not merely expand the global supply of tradable goods; it also intensifies competition for standardisable product ranges. When these imported goods (or inputs) are cheaper, the consumption basket rises less quickly in price, which helps contain inflation in manufactured goods and increases real income for part of households. Baldwin further argues—through a monetary lens—that, over time, goods prices have risen more slowly than service prices, which makes plausible the idea that international openness and value-chain organisation have acted as a disinflationary “tailwind” for goods.
This thesis is consistent with part of the central-bank literature on the 1990s–2000s. For the Bank of England, the integration of emerging economies into the global economy improved the United Kingdom’s terms of trade through lower import prices, a mechanism that weighed on domestic inflation (even if its magnitude and persistence depend on monetary policy and wage dynamics).40 The Reserve Bank of New Zealand expresses a similar idea: the development of production in Asia produced a “deflationary” impulse through falling import prices, increasing the purchasing power of nominal incomes in importing countries.41 In other words, even if international competition may have put downward pressure on wages in certain exposed segments, the fall (or slower rise) in the prices of tradable goods could, at the same time, have supported demand by stabilising purchasing power.
More recent empirical work strengthens this “prices → purchasing power” channel. Jaravel and Sager estimate that the rise in trade with China led to a substantial fall in consumer prices in the United States, and they quantify, for 2000–2007, an average gain in purchasing power of around $1,500 per household per year.42 Bai and Stumpner, using micro data (barcodes, prices, and expenditure), likewise find a significant negative effect of Chinese imports on the prices of the goods concerned, with a headline order of magnitude of around a 0.19 percentage-point annual reduction in the price index of importable or exportable goods.43 These findings align with institutional syntheses: the OECD indicates that, by lowering the prices of essential and heavily traded goods (such as food or clothing), trade improves affordability and supports the purchasing power of those who need it most.44 Similarly, the WTO summarises the central distributive effect of the import price shock: cheaper imports raised households’ purchasing power, especially towards the bottom of the income distribution.45
Finally, it is important to keep in mind the social counterpart of this mechanism. Pehnelt notes that globalisation can weaken the bargaining power of certain employees and weigh on nominal wages, while supporting real wages through access to cheap imports—an arbitrage that makes a favourable macroeconomic average compatible with very divergent trajectories across sectors and territories.46 This is precisely the point that matters here: over the period, international competition and offshoring may have acted as a lever supporting aggregate demand, not by directly boosting the wage bill, but by slowing the rise in the consumption basket—and thus by strengthening purchasing power.
A decline in offshoring, in a world where income gaps are narrowing47 and tariff barriers are returning to the agenda, should weigh on purchasing power and, consequently, on demand in the most developed countries.
The challenge of managing restructuring
Restructuring triggered by technological innovation and offshoring cannot be reduced to factory closures or redundancy plans: it reshapes the content of jobs and, with it, the nature of the skills that are rewarded. In the “tasks/skills” approach, automation primarily targets routine, codifiable, and repeatable tasks, while complementing tasks involving analysis, coordination, design, or customer interaction.48 Globalisation plays a similar role, because the fragmentation of value chains makes it possible to relocate standardisable segments of production, reinforcing, in advanced economies, specialisation in upstream and downstream functions (engineering, design, software, marketing, logistics, supplier management).49 In both cases, adjustment concerns not only the volume of jobs, but their “composition”: the profiles sought shift faster than education pathways, certifications, and professional mobility.
This shift brings a management challenge: the pace of change in the demand for skills frequently exceeds that of the supply of skills. The “race” between education and technology implies that, if human-capital accumulation does not keep up, skill shortages emerge in expanding activities, while the skills released by contracting activities are difficult to recombine.50 Added to this are geographical and institutional frictions: jobs destroyed are often concentrated in particular local labour markets, while jobs created emerge elsewhere, in other sectors, with different requirements. The literature on trade shocks also stresses that local adjustment is slow—participation and wages remaining durably depressed, unemployment remaining durably high—which makes reconversion more complex than a simple transfer “from one job to another”.51 In other words, even when the economy has new needs at an aggregate level, it may fail to translate them quickly into hiring, for lack of effective matching between available skills and required skills.
In this setting, the gap between available and required skills weighs on job creation in two ways. First, it lengthens vacancy durations and increases transitional unemployment, which erodes incomes, encourages downward mobility, and reduces demand’s capacity to absorb supply. Second, it influences the direction of technical change: when the relevant skills are scarce, investment is more likely to flow towards substitutive solutions (automation, standardisation, outsourcing) rather than towards organisational forms that raise qualifications and stabilise career paths. Managing restructuring therefore becomes a driver of automation without a corresponding creative counterpart when society fails to keep pace with the rhythm imposed by the labour market.
Population ageing
Demographic ageing weighs on Western economies through a double structural effect: the retirement of the large baby-boom cohorts, and the sustained decline in fertility, which reduces the relative number of working-age people.52 In pension systems largely based on pay-as-you-go financing, this shift means that a smaller working population funds a larger retired population, while rising life expectancy extends the average duration of pension payments.53 The constraint is not only accounting-based: it translates politically into recurring trade-offs between higher contributions, a later effective retirement age, changes to indexation rules, or a relative reduction in benefits.54
These trade-offs feed directly into demand. On the one hand, higher levies (contributions, taxes) reduce the disposable income of working-age households, limiting consumption growth. On the other hand, when the chosen path is to contain pension spending, the growth of retirees’ incomes slows, which also restrains their expenditure. The constraint also operates through the public finances: the rise in age-related spending (pensions, healthcare, long-term care) tightens fiscal space, pushing policymakers to trade off against other items (public investment, education, infrastructure) or to rely more heavily on debt.55 In both cases, the macroeconomic effect is unfavourable to aggregate demand, while simultaneously limiting the resources that can be mobilised to support supply—for instance active labour-market policies, training and reconversion programmes, or place-based measures to manage restructuring.
Finally, ageing is associated with a less expansionary consumption dynamic. At the microeconomic level, life-cycle models describe a stabilisation and then a reduction in spending at retirement, partly because incomes become more constrained and because longevity uncertainty encourages precaution.56 Empirical work on retirement further suggests that, even if the composition of expenditure shifts (fewer durables and activity-related expenses, more healthcare), total spending tends to grow more slowly.57 At the macroeconomic level, as the share of older people rises, this lower consumption intensity contributes to weakening the momentum of demand—and, by extension, the economy’s capacity to absorb supply-side gains generated by innovation.
Creative destruction under pressure
The various constraints discussed above (technology, globalisation, restructuring, ageing) accumulate and weigh on creative destruction. In Schumpeter’s account, it rests on a cumulative dynamic: innovation opens markets, reshuffles positions, shifts employment, and then higher incomes and the diffusion of new goods support further investment. This scheme works all the better when productivity gains translate into an expansion of output and a rise in solvent demand. In the contemporary configuration described above, however, this articulation weakens.
In tangible sectors, productivity gains tend to level off, as industrialisation has already exploited a large share of the technical levers (standardisation, mechanisation, quality control, etc.). Innovations there are more often incremental, and their diffusion runs up against organisational, skills, investment, and acceptability constraints. In intangible sectors, growth is more polarised: returns, network effects, and economies of scale favour concentration, which tends to slow diffusion and to steer innovative effort towards extending dominant ecosystems rather than multiplying entrants. Creative destruction continues, but it manifests less as a succession of market openings than as a reconfiguration within more locked-in structures.
In this context, demand emerges as the closing variable. When supply capacity advances faster than outlets, the central challenge is no longer only to produce better, but to sell more—and to maintain margins in an environment where volume growth is slowing. Non-technological factors such as restructuring, fiscal constraints, or ageing reinforce this shift: they weigh on consumption, public investment, and economies’ capacity to absorb supply-side gains rapidly. In other words, the main brake lies in the difficulty of turning technical progress into a durable expansion of demand.
This is where automation changes status. Under a regime of dynamic demand, it can accompany market expansion: it lowers prices, increases volumes, frees labour for new activities, and employment recomposes. Under a regime of constrained demand, it tends to become a defensive strategy: firms automate first to reduce unit costs, secure production, and protect margins in a harsher or more concentrated competitive environment. This logic mechanically increases pressure on employment, and therefore on demand—especially if gains concentrate in profits and rents rather than in distributed incomes.
The vicious circle can then be stated simply. Slowing demand encourages firms to accelerate automation (capital–labour substitution, rationalisation, headcount reduction, intensification), because growth through volumes is less accessible. But this automation—especially when coupled with concentration—compresses labour’s share, strengthens inequalities, and weakens the growth of median incomes, which reduces aggregate demand. Stiglitz explicitly stresses that high inequality “weakens aggregate demand”, pushing economies towards artificial macroeconomic support (highly accommodative monetary policy, a search for financial substitutes).58 Yet persistently low rates—used to stabilise activity when demand is lacking—can encourage “excessive automation”, by making the technology choice that replaces labour relatively less costly.59 The loop closes: weak demand → incentive to automate → pressure on incomes and demand → renewed low-rate policies → automation becomes even more attractive.
Under these conditions, creative destruction is “under pressure” in the strict sense: weaker demand growth means less space for the entry of new producers, more cost-based competition, and a stronger preference for rationalisation innovations rather than market-creating innovations. The process does not disappear, but it is distorted: it becomes more socially conflictual, more economically concentrated, and more macroeconomically fragile. As long as demand remains constrained, automation risks compensating for the absence of outlets instead of opening new ones—and creative destruction, rather than generating an expansive cycle, can become trapped in a dynamic of defensive adjustment.
Notes
1 Joseph Schumpeter, The Theory of Economic Development, Harvard University Press, 1939 (1911), chapter II & VI.
2 Ibid.; Joseph Schumpeter, Capitalism, Socialism and Democracy, Taylor & Francis e-Library, 2003, chapter VII.
3 M.D., Pfarrer & K.G. Smith, “Creative destruction”, M. Hitt & D. Ireland (Eds.), The Blackwell Encyclopedia of Management, Blackwell, p. 50-52.
4 Eric. J. Hobsbawm, Industry and empire : from 1750 to the present day, Penguin, 1969 ; Prasannan Parthasarathi, Why Europe Grew Rich and Asia Did Not: Global Economic Divergence, 1600–1850, Cambridge University Press, 2011.
5 Ibid.
6 Sven Beckert, Empire of Cotton: A Global History, Alfred A. Knopf, 2014.
7 Ibid., chapter 3.
8 Ibid., chapter 6.
9 Ibid., chapter 7.
10 Jane Humphries, Childhood and Child Labour in the British Industrial Revolution, Cambridge University Press, 2010.
11 Katrina Honeyman, Women, Gender and Industrialisation in England, 1700–1870, St. Martin’s Press, 2000.
12 Maxine Berg, The Age of Manufactures, 1700–1820: Industry, Innovation and Work in Britain, Routledge, 1994.
13 Sven Beckert, op. cit., chapter 6 ; Prasannan Parthasarathi, op. cit.
14 Sven Beckert, op. cit., chapter 4.
15 Prasannan Parthasarathi, op. cit.
16 Ibid.; on imperial ambitions and mercantilism, see: https://damiengimenez.fr/wpdgi_article_en/wealth-as-a-political-principle-england-17th-18th-centuries/#Mercantilism_vs_free_trade
17 Source : https://companiesmarketcap.com/. Nvidia, $4.597 T ; Apple, $4.021 T ; Alphabet, $3.806 T ; Microsoft, $3.515 T ; Amazon, $2.421 T ; Broadcom, $1.648 T ; Meta, $1.639 T. Market capitalisations as of 2 January 2026, at market close.
18 Jonathan Haskel and Stian Westlake, Capitalism without Capital: The Rise of the Intangible Economy, Princeton University Press, 2017.
19 Robert J. Gordon, The Rise and Fall of American Growth: The U.S. Standard of Living since the Civil War, Princeton University Press, 2016.
20 Ibid., see also the chart showing the change in the growth rate of total factor productivity (TFP).
21 Tyler Cowen, The Great Stagnation: How America Ate All the Low-Hanging Fruit of Modern History, Got Sick, and Will (Eventually) Feel Better, Dutton, 2011.
22 Robert U. Ayres, Benjamin Warr, The Economic Growth Engine: How Energy and Work Drive Material Prosperity, Edward Elgar, 2009 ; Robert U. Ayres, Benjamin Warr, Economic Growth Models and the Role of Physical Resources, INSEAD, 2002 ; Reiner Kümmel, The Second Law of Economics: Energy, Entropy, and the Origins of Wealth, Springer, 2011.
23 https://data.bls.gov/timeseries/MPU0048013
24 The literature on the productivity/TFP revival associated with ICT identifies a short window around the turn of the 1990s–2000s, ending around 2004. The 1996–2004 delimitation is stricter (centred on the core of the revival): it is intended to avoid the transition years in the mid-1990s and to capture the phase in which the acceleration is clearest.
25 Source: BLS Industry Productivity employment (NAICS 493, thousands of jobs) via FRED table data: https://fred.stlouisfed.org/series/IPUIN493W200000000
26 Source: BLS selected service-providing industries indices (NAICS 493): https://www.bls.gov/productivity/charts/selected-services-industries-labor-productivity.xlsx
27 Miguel Rodríguez-Garcia, Angel Ortiz Bas, José Carlos Prado-Prado, Andrew Lyons, Fulfillment costs in online grocery retailing: Comparing retail store and warehouse strategies, International Journal of Production Management and Engineering (Universitat Politècnica de València), 2023 ; Maximilian Schiffer, Nils Boysen, Patrick S. Klein, Gilbert Laporte, Marco Pavone, Optimal Picking Policies in E-Commerce Warehouses, Management Science (INFORMS), 2022.
28 https://www.census.gov/retail/ecommerce.html
29 https://www.cnbc.com/2025/09/02/google-antitrust-search-ruling.html
30 https://www.reuters.com/sustainability/boards-policy-regulation/meta-defeats-us-antitrust-case-over-instagram-whatsapp-2025-11-18/
31 Ryan A. Decker, John Haltiwanger, Ron S. Jarmin, Javier Miranda, Declining Business Dynamism: What We Know and the Way Forward, American Economic Association, 2016.
32 Dan Andrews, Chiara Criscuolo, Peter N. Gal, Frontier Firms, Technology Diffusion and Public Policy: Micro Evidence from OECD Countries, OECD Publishing, 2015.
33 Ryan A. Decker, John Haltiwanger, Ron S. Jarmin, Javier Miranda, Where Has All the Skewness Gone? The Decline in High-Growth (Young) Firms in the U.S., National Bureau of Economic Research, 2015.
34 Ibid.
35 Dan Andrews, Chiara Criscuolo, Peter N. Gal, op. cit.
36 The participation rate reported by FRED is the percentage of the population aged 16 or over that is either employed or actively seeking work. Retirees are therefore excluded from this participation rate.
37 Source : https://fred.stlouisfed.org/series/A794RX0Q048SBEA
38 https://www.newyorkfed.org/microeconomics/hhdc
39 Richard Baldwin, Risks and Global Supply Chains: What We Know and What We Need to Know, European Central Bank, 2022 ; Richard Baldwin, Trade and Industrialisation after Globalisation’s 2nd Unbundling: How Building and Joining a Supply Chain are Different and Why it Matters, National Bureau of Economic Research, 2011.
40 Alex Bowen, Ken Mayhew, Globalisation and Inflation: What Have We Learned from Recent Experience?, Bank of England, 2008.
41 Glen Hunt, Emerging Asia and Global Inflation, Reserve Bank of New Zealand, 2007.
42 Xavier Jaravel, Erick Sager, What are the Price Effects of Trade? Evidence from the US and Implications for Quantitative Trade Models, Centre for Economic Performance (LSE), 2019.
43 Liang Bai, Sebastian Stumpner, Estimating US Consumer Gains from Chinese Imports, Banque de France, 2019.
44 OECD, Global trade and open markets, OECD. URL : https://www.oecd.org/en/topics/policy-issues/global-trade-and-open-markets.html
45 WTO, World Trade Report 2024: Trade and inclusiveness – How to make trade work for all, World Trade Organization, 2024.
46 Gernot Pehnelt, Globalization and Inflation in OECD Countries, European Centre for International Political Economy, 2007.
47 WTO, op. cit.
48 Daron Acemoglu, David Autor, Skills, Tasks and Technologies: Implications for Employment and Earnings, Elsevier, 2011.
49 Richard Baldwin, The Great Convergence: Information Technology and the New Globalization, Harvard University Press, 2016.
50 Claudia Goldin, Lawrence F. Katz, The Race between Education and Technology, Belknap Press of Harvard University Press, 2008.
51 David H. Autor, David Dorn, Gordon H. Hanson, The China Shock: Learning from Labor-Market Adjustment to Large Changes in Trade, Annual Reviews, 2016.
52 Ronald Lee, Andrew Mason (dir.), Population Aging and the Generational Economy: A Global Perspective, Edward Elgar, 2011.
53 Nicholas Barr, The Economics of the Welfare State, Oxford University Press, 2020.
54 Jonathan Gruber, David A. Wise (dir.), Social Security and Retirement around the World, University of Chicago Press, 1999.
55 Laurence J. Kotlikoff, Generational Accounting: Knowing Who Pays, and When, for What We Spend, The Free Press, 1992.
56 Angus Deaton, Understanding Consumption, Oxford University Press, 1992.
57 James Banks, Richard Blundell, Sarah Tanner, Is There a Retirement-Savings Puzzle?, American Economic Review (American Economic Association), 1998.
58 Joseph E. Stiglitz, Inequality and Economic Growth, Wiley-Blackwell, 2016. Stiglitz emphasises in particular that people at the bottom of the distribution spend a larger percentage of their income than those at the top.
59 Anton Korinek, Joseph E. Stiglitz, Artificial Intelligence, Globalization, and Strategies for Economic Development, National Bureau of Economic Research (NBER Working Paper No. 28453), 2021.